Background
Date/Time dimension is very common and is used in any BI solution. Because any business would like to get business insights and see how their business has done in the past and is going to perform in the future. Whether it’s CFO of a company or Sales/Marketing team they would like to analyze their key performance indicators over a specified period. For e.g. Sales vice president would like to see the volume of their sales by month or quarter or year by product and/or by Geography.
CFO is interested in revenue, receipts, costs/overheads, cash flow over a specified period. S/he would also like to do a variance analysis such as actual vs budget. Another common example is to do Like for Like sales analysis for current and previous years by month, quarter and year. In this Blog I will cover how to build a date dimension in Microsoft Power BI from scratch. So without much ado let us deep dive into an implementation.
Creating Date dimension
If you want to follow these steps then you need to have downloaded Microsoft Power BI Desktop. If you already have not downloaded it then you can sign-up for a Microsoft account for free and download it using the link given here (Power BI Desktop Download). I am assuming you have successfully downloaded and installed Power BI Desktop on your PC or laptop before following the below steps.
Step 1 Launch Power BI Desktop

Fig 1 Power BI Desktop
Fig 1 shows the Power BI Desktop. I have already opened an existing Project. But you can create a new project and name it as appropriate. On the left hand side toolbar we have three toolbar buttons. We have three views namely Report view, Table View and Relationship View. I am going to select the Table view option see Fig 2 below. You need to click on the table view toolbar option to see the menus shown here.

Fig 2 Table Tools menu (New table toolbar option highlighted)
We will select and create a new table and name it as “Date”. Fig 3 shows the new table created and we will type the following DAX command in formula bar DAX stands for Data Analysis Expression. It’s a query language to use different built-in DAX functions. It’s very similar to excel formulas. If you have used Excel then learning DAX should be easier for you. Those who are not familiar with Excel please don’t worry as this is easy to learn.
Date= Calendar(Date(2017,01,01),Date(2025,12,31)
Fig 3 Date Dimension view after creating with Calendar formula
You can see the formula is similar to the excel formula. Let us dissect this formula to understand more about it.
Left hand side of the expression (“=”) is Date. This is the name of the dimension table and the right hand side is the Calendar DAX formula which accepts two parameters. Parameter1 and Parmeter2 are both date data types and accept start and end date. We are using the Date DAX function and pass year, month and day for both the dates. In the example I am creating a date range between 2017 to 2025. Fig 3 shows the screen shot with the completed formula and the result.
We can see in table view results with a single column (Date) with all dates shown from 01/01/2017 till 31/12/2025. You may need to scroll down to see all the dates in the range we specified.
But we need to add a few more columns to this table. As we want to analyze our data by month, quarter, half year and year. We need to create these custom columns and to create these columns we may need some additional columns such as month number.
Let us start by creating two new custom columns: month number and year.
Step 2 Creating Month Number and Year Custom Columns
We will create two custom columns and use following formulas in formula bar
- Month = Month(‘Date’[Date’])
- Year = Year(‘Date’[Date])
These formulas are simple and I will explain each part of it. Left side of the expressions are name of the new columns namely Month and Year.The right side of expression are two functions Month() and Year() and both take date as a parameter. If you remember we created a “Date” column with Calendar() expression we need to pass this column name as a parameter as this column data type is Date. The syntax for it to specify the table name in single quotes and then name of the column in rectangular bracket
‘TableName’[ColumnName]. So our table name is “Date” and also column name is “Date”.
Result is displayed in Fig 4 shown below.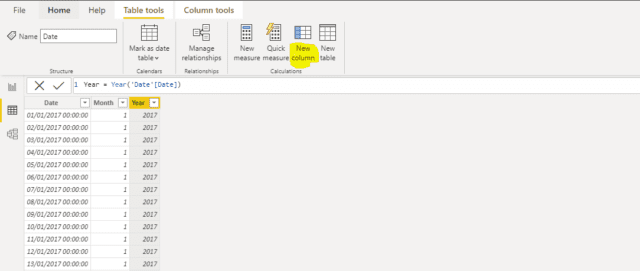
Fig 4 Result of defining Month and Year Columns
From figure 4 you can see two new columns added to the table. To add a new column we need to use the new column toolbar option as highlighted in this figure. Now we need to create month and year column in the format “mmm yyyy” (e.g. Mar 2021) , Quarter and half year.
Step 3 Creating MonthAndYear Column
To create the MonthYear column we will use the DAX expression as shown below.
MonthYear = Format(‘Date’[Date],”mmm yyyy”)
Here again the left side of the expression is the name of the column “MonthAndYear”. The right side of expression Format() function which accepts two parameters. Parameter1 is the data to be converted to string and the second parameter is the format string to specify how we want to represent the string. In our case the first parameter is our date column value and the second parameter is the format of how we want to represent the date. Since we want to display it as the name of the month followed by the year the format is “mmm yyyy”.
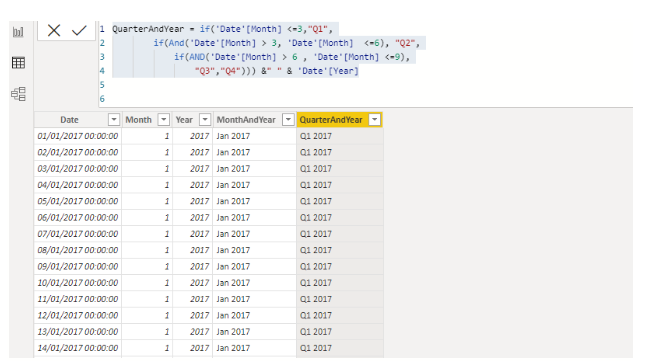
Step 4 Creating QuarterAndYear Column
As we want to represent all 4 quarters we need to compare the month number of the date and assign it as following
- Q1 if month is < 3
- Q2 if month between 3 and 6
- Q3 if month between 7 and 9
- Q4 if month > 9
And then concatenate it with the Year column. So DAX formula will be as below.
QuarterAndYear = if(‘Date'[Month] <=3,”Q1″,
if(And(‘Date'[Month] > 3, ‘Date'[Month] <=6), “Q2”,
if(AND(‘Date'[Month] > 6 , ‘Date'[Month] <=9),
“Q3″,”Q4″))) &” ” & ‘Date'[Year]
So let us understand this formula as it may look a bit complex. But it’s not if you understand section by section.
The left side of the expression QuarterAndYear is the name of the column.
The right side starts with a nested if statement. This means it has an if statement within another if statement. The pseudo code looks like this.
If month < 3 then Q1
If month > 3 and month <= 6 then Q2
If month > 6 and month <=9 then Q3
Else
Q4.
General format for if function is if(condition is true, value1, value2)
I hope this makes sense. If you are a programmer or familiar with any programming language then this may be easier to understand. We then used “&” to concatenate the year column. We also separated the year with one space for readability . The output is shown in fig 5.

Fig 5 QuarterAndYear Column formula and data values in that column
Now let us create half year column
Step 5 Create HalfYear column
Formula for this is much simpler as we only have two half years H1 & H2 so if month is <= 6 then H1 else H2. DAX formula is shown below
HalfYear = if(‘Date'[Month] <= 6, “H1″,”H2”)
This formula is simple with a single if statement. So output is shown in figure 6.

Fig 6 Date dimension table with all columns
Now that we have all columns added. The date dimension is ready to use. In the next blog I will cover Dimension hierarchies. Till then thank you.