I had gone to Park Royal Industrial Area in London with my friend to meet one of his clients who runs an Import/Export Distribution business and his company was specializing in all types of tiles. This company has his office in one of his warehouses. He had three additional warehouses in the same premises.
During our conversation he said, I am not technical and we don’t understand a lot of buzz words in your BI world but can you explain to me in plain English what is BI & BI Analytics? and how it can help my business?

I was really not expecting this question and was a bit surprised with his question. I said OK let me try to give a simple definition.
“Business Intelligence will provide relevant and reliable information about a business to the right people and the right time to make informed decisions for efficient operations and to improve your profitability”.
I said let me take this opportunity to understand your business and come up with high level recommendations on how BI & Business Analytics can help. As a first step I tried to understand his business and how he and his team run their day to day operations and what are his key pain points?
In summary he had around 10 key suppliers from multiple countries such as Italy, Spain, South Africa and India and other south Asian countries. I was surprised and pleased to know that India (which is my home country) exports a variety of high quality tiles at very competitive prices. So he imports the tiles of different brands and qualities from these suppliers and then distributes in wholesale to local retailers in London and other parts of the United Kingdom. He was also exporting them outside the UK to some countries. But 70% of his sales revenue was from local clients and 30% was from exports.
We then had a short trip to his warehouses and spoke to key team members of his Purchasing, Sales, Warehouse departments and tried to understand how they run their operations and their inputs on what improvements can be made for smoother operations. Based on this short brief and talking to members of his team below were my key observations
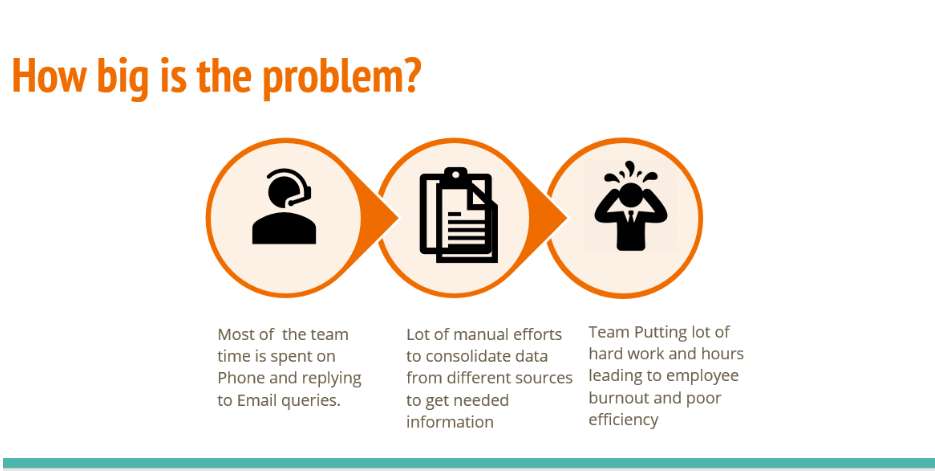
- Most of their processes were manual and a lot of their time was spent on phone calls and replying to email queries from customers/suppliers.
- Processing of Purchase and Sales order was completely manual
- No clear visibility of stock position and Inventory status
- No use of any ERP system
- Only tools used were Simple Word and Excel and Finance package Quick book.


From the above figure the solution is split in three sections. First section on the left is all about streamlining the key operational processes such as Purchase, Sales, Inventory and Finance processes. This will enable your business to run your operations smoothly and efficiently. You can do by implementing an ERP specially suitable for your industry vertical as in this case it is in the distribution business. There are many ERP vendors in the market and you have a lot of choices to pick from based on what suits best for your business and also value for your money.
Other two sections on the right focus on getting real time insights of your business by implementing business analytics. Business analytics will provide you real time insights to key stakeholders such as Management team, Suppliers and Warehouse Managers to appropriate key performance indicators based on their roles. So it can enable them to monitor, track and make informed business decisions. For example Dashboard for suppliers will help them to monitor in real time the stock positions of products they supply to their customers and deliver them next lot just in time by pushing them new consignment at the right time. For warehouse managers their custom dashboard will enable them to stay in control of a deliveries/shipments, Stock movements, rejections and damages.
For a sales/marketing team a customer feedback is important and can provide some pointers which can help to address any customer grievances and constantly improve the product’s quality and improve service quality and also prepare marketing campaigns to suit different types of customers. Architecture to implement BI solution is shown below.

From the above figure you can see that data is key for any business. So the first stage is to capture data from different sources such as structured data from your ERP system, external systems as well as non structured data such as from different social media. The next crucial stage is to extract and transform your data into meaningful business insight and keep it in a data warehouse which can then be used to implement visualizations using tools such as Microsoft Power BI. But once you have data in centralized secure database you can then constantly learn, correct and optimize to improve your business processes and increase your profitability and improve business efficiency.
Advanced BI techniques can be applied using Artificial Intelligence by applying neural network to train the model and use it for predictive analysis and automate mundane processes as applicable. Finally I would say it is not to implement it once and then forget, but it is an iterative process where we need to constantly evolve based on insights from business and keep on learning and improving.