Background
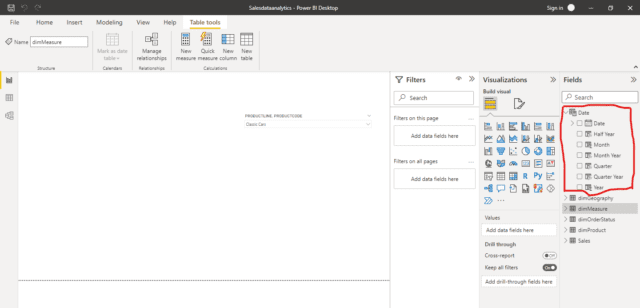
Fig 1 Power BI Desktop with Date Dimension
Whenever we build any Business Intelligence solution then at the heart of it is Design of robust data warehouse. Any data warehouse will consist of cubes or facts and dimensions.
Within dimension the dimension hierarchies are very useful to group the dimension members in the respective order of their hierarchy in the group. This can provide consolidated information about key business performance indicators.
For example it’s a very common business scenario to view Sales revenue of a company by Year, Half year, Quarter and by month. Or the user may want to slice and dice the data by different product categories or by Sales channels such as retail, wholesale or online.
So we need to create different hierarchies within the dimensions of our interest.
Another typical scenario with Time dimension is to have separate hierarchies for Financial year, Calendar Year or Year to date hierarchies.
So now that I have covered different use cases where the dimension hierarchies will be useful. Let us take a deep drive into building them using Microsoft Power BI Desktop.
So we will cover it step by step in this blog.
Creating Time dimension hierarchy:
So let us start to build a Time dimension hierarchy to group the members by Year, Half year, Quarter and Month. I have already written a blog on how to build Time dimension using Microsoft Power BI. If you would like to refer to it then please use the link “How to build Time dimension using Microsoft Power BI” .

Fig 2 Date dimension with it’s key members
Launch Power BI desktop. If you don’t have one then you can download it for free using the link here. I have launched my Power BI project for Sales data analytics. We can see all the members of Date dimension. I have created a full video based tutorial on Power BI. If you are interested in watching the complete playlist then please refer to the link “Sales Data Analytics a Case Study using Microsoft Power BI”.
Creating hierarchies is easy. As we want the Year member of the Date dimension to be our Top level member we will right click on it and use the create hierarchy option.
We will name it as “By Year-Half Year-Quarter Year-Month Year”.
You can then right click on the Half Year member and use the option Add to hierarchy → By Year-Half Year-Quarter Year-Month. Please repeat the same steps for Quarter Year and Month Year members respectively. The order of members added to hierarchy should be the order in which you would like to group them. The newly created hierarchy is as shown below.

Fig 3: Time dimension hierarchy
Let us see how it looks in a Visual widget. We will use a slicer widget from the “Report” view. We can drag and bring the slicer widget in the blank area of “Report view”

Fig 4: Hierarchy with Year 2019 node expanded
We can see the members of Date dimension. I have expanded the 2019 node so you can see all the members below it and how they have grouped together in hierarchical fashion.
Building Geography Dimension Hierarchy
Let us now build the Geography dimension hierarchy now. We would like to group them by Territory→ Country→ Region→ City→Postcode
Again now we will right click on our top level member which is Territory and select “Create hierarchy option”. We will then add Country, State, City, Post Code members. We can name the hierarchy as By Territory-Country-State-City hierarchy.
Fig 5: Geography Dimension with all members
Let us see how it looks in the Report view. We will drag the Slicer widget to the Report view area. We will then drag the hierarchy we created above and drop it on the slicer widget. The hierarchy will look as shown below. I have expanded APAC territory to show how different members under it are grouped together.

Fig 6 Geography hierarchy with APAC node expanded.
You can see how easy it is to build dimension hierarchies in Microsoft Power BI. I hope you will find this Blog useful.